Multiple Opening Analysis
Did you know that if you have a bridge opening and one or more culverts at a single river crossing a Multiple Opening Analysis is required?
This is a common question. It’s often desirable to have a table of timing for peak stages and flows for dam breach models. This allows you to track the arrival of the flood wave at all locations downstream of the dam. However, the typical output plots in HEC-RAS are not very helpful in providing this information. You could look at each cross section’s stage and flow hydrograph, and pick off the time for the peaks, but this can be very tedious and time-consuming. There is a much faster way to get this information using the DSS Viewer in HEC-RAS.
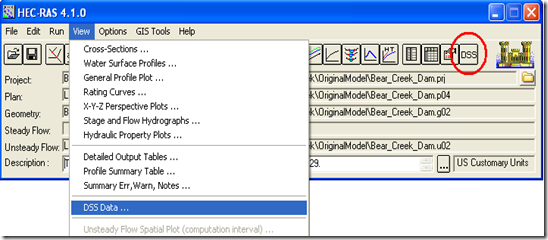
Go to the DSS viewer on the main RAS window.

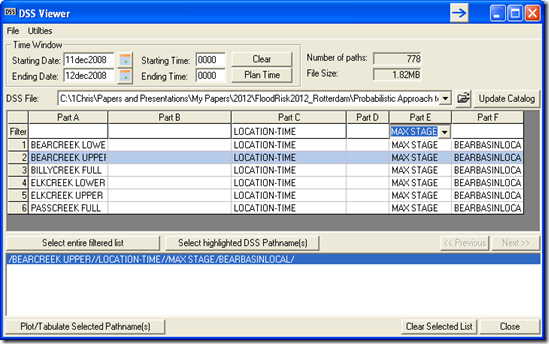
Once there, filter the records as follows by clicking in the blank cell at the top of each column and selecting what you want to see from the dropdown box:
Part A: Select the Reach you want to look at
Part B: Leave Blank
Part C: Select LOCATION-TIME
Part D: Leave Blank
Part E: Select MAX STAGE or MAX FLOW
Part F: Select the Plan you want to view.

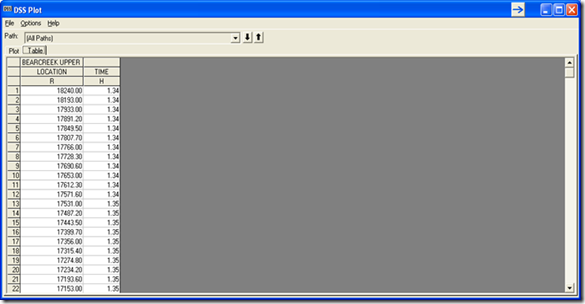
Once you have the record you’re interested in, double click it in the filter table so that it is brought down to the list box at the bottom. Then highlight the record in the list box and click “Plot/Tabulate Selected Pathname(s). You should see a graph that plots out the Simulation Time for Max Flow or Stage for every cross section in the selected reach.
Within the DSS Plot window, select the “Table” tab to see tabular output.

Comments
sarvesh
on February 24, 2012Wow, I think that answers everything.
jungbum
on May 7, 2012hi,
your comment is wonderful..
hm… i have a question..
how do you calculate a wave celerity in HEC-RAS? or by hand??
Chris G.
on May 8, 2012Hi Jungbum-
you can get an overall reach wave speed (wave celerity + velocity) by taking the reach length and dividing by the travel time as determined by the method described in the blog post above. If you would like to determine a discrete, localized wave celerity, you can retrieve the hydraulic depth from the profile output table and compute it by (g*d)^0.5 (square root of gravity times hydraulic depth). Then add velocity (also from the profile table) to that to get wave speed.
Hope this helps. Best of luck.
Chris
Anonymous
on October 2, 2014I'm interested in getting the max velocity at all bridge locations in the model. Any advice on how to do that would be appreciated.
Chris Goodell
on October 6, 2014I don't think you can get max velocity from the dss file. However, you could get the velocity plots out of the RAS general profile plot for each profile. Copy to Excel. Then in Excel, filter out everything other than the bridges. Then select all velocities for each bridge and set a cell equal to the max value of the selection. (i.e. =MAX(D2:D13)"
darwin
on October 17, 2015i would like to get flood time arrival to get the time lag downstream of a dam so that people can be removed from danger area after dam breaches
Chris Goodell
on October 19, 2015Did you read the article above?
Samuel Vingerhagen
on November 5, 2017It looks like HecRas i showing the lowest cellvalue as upstream HW. Maximum HW can be much higher. Is this true?
Chris Goodell
on November 5, 2017Not sure. If you figure it out please share.
vc sharma ([email protected])
on November 10, 2017Can anyone, please explain me about the physical process of 1D unsteady flow modeling in HECRAS (how the model is calculating depth, time and velocity). Because referring manual is taking long time to me or else suggest me any presentation or document which explains briefly.(mail id attached with my name)
Thank you
Add Your Comment