May 24, 2024
Multiple Opening Analysis
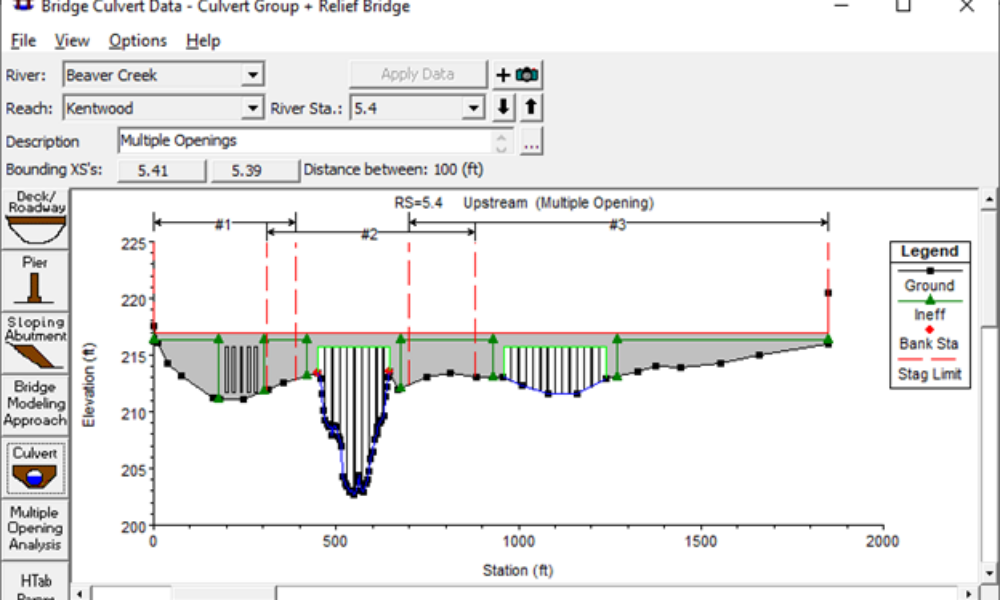
Did you know that if you have a bridge opening and one or more culverts at a single river crossing a Multiple Opening Analysis is required?
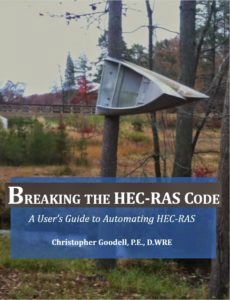
4. (Optional) The book, “Breaking the HEC-RAS Code“. While you can do this example without it, this book is a great resource for automating HEC-RAS using the HECRASController.
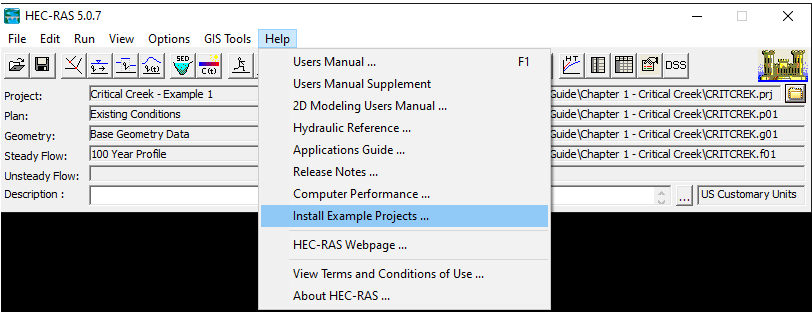
Step 1: Make sure you have HEC-RAS 5.0.7 installed on your computer. Also, make sure you have the HEC-RAS Example Data projects installed. If you don’t, or aren’t sure, go to the Help menu item in HEC-RAS and click on “Install Example Projects…”
By default RAS will want to install these projects here: C:\Users\[your user name]\Documents\HEC Data\HEC-RAS, but you can store them anywhere you like on your computer. If you don’t have the compressed file of example projects that comes with the installation of HEC-RAS, you’ll get an error if you try to install them from the menu item. You’ll have to get that compressed file of example projects directly from the HEC website.
Step 2: Open up the Critical Creek HEC-RAS example project. If you installed your example projects to the default directory, it will be here: C:\Users\[your user name]\Documents\HEC Data\HEC-RAS\Example Data\Applications Guide\Chapter 1 – Critical Creek. You’ll see this is a very simple 1D steady flow project. Make a note of the path and filename of the Critical Creek project on your computer. For example, mine is C:\HEC-RAS Examples\Applications Guide\Chapter 1 – Critical Creek\CRITCREK.prj. You will be using the filename and path later in the code. Once you confirmed you can open up the Critical Creek project in HEC-RAS and you’ve spent some time getting familiar with it, go ahead and close HEC-RAS.
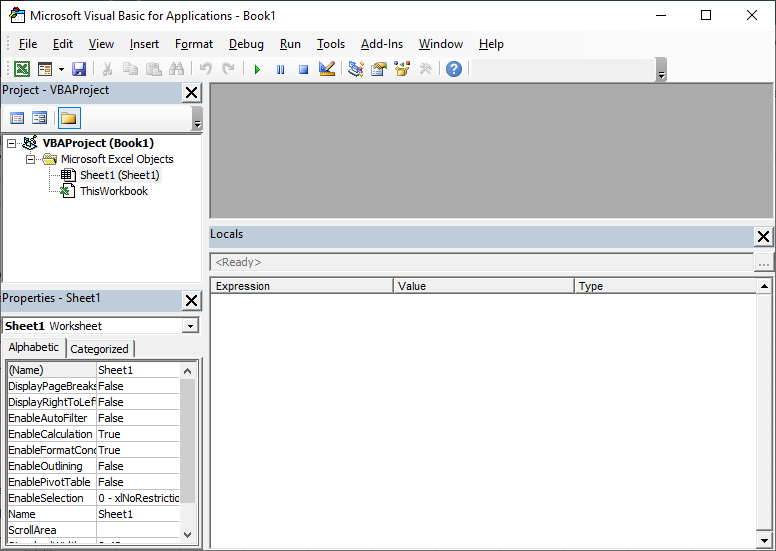
Step 3: Open up Excel. In Excel, we’ll use the Visual Basic editor to write our automation code. From the Developer menu item in Excel, select “Visual Basic”. Here’s a link that shows how to add the Developer Tab, if you don’t already have it on your ribbon. Alternatively, you can use the shortcut keys Alt F11. The Visual Basic editor will open up and looks like this:
Now let’s add in the HECRASController API as a reference to this project. This will give us access to the HECRASController program libraries for use in our code. This will make it possible to do things like automatically open HEC-RAS, run HEC-RAS, change n-values, etc. The HECRASController API comes with the installation of HEC-RAS. So if you have HEC-RAS on your computer, you already have the HEC-RAS API. Add in the HECRASController as a reference in the “Tools” menu item by selecting “References…” The References window will show up like this:
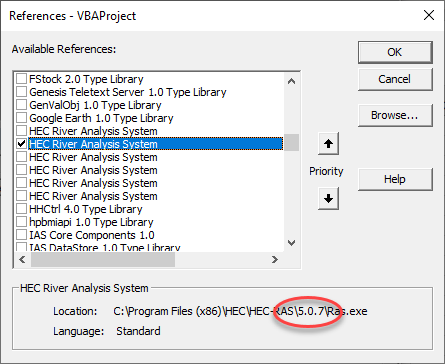
Scroll down until you see “HEC River Analysis System”. If you have multiple versions of HEC-RAS installed on your computer, you’ll see a reference here for each one. Make sure to only check the box for the version of HEC-RAS you wish to use. I’m going to use Version 5.0.7, so that’s the one I’ve selected. Click OK, and now you’ll have access to the HECRASController API. If you don’t see HEC River Analysis System in alphabetical order, check the top of the list. If Excel recognizes you’ve used it before, it will sometimes move it to the top of the list.
Step 4. Insert the code. In the directory tree (usually this is docked in the upper left), right-click on VBAProject and select Insert…Module. This will add a space for us to write and/or insert programming code. Now copy the code at the bottom of this post and paste it into the module. Copy everything in red font. Your Visual Basic editor should now look like this:
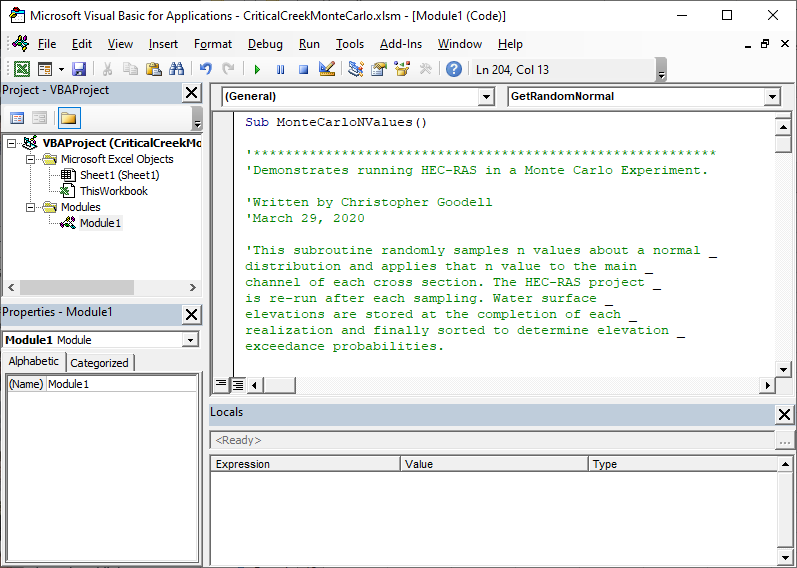
Note that the text in green font are comments. They are made comments by putting an apostrophe (‘) in front of it. The comments are not actually part of the programming code, but are in there to help explain what each block of code does. The code itself is in blue and black font.
*If you have red font in the Visual Basic Editor, it is likely that the apostrophes (‘) before the comments were pasted in as accents (`). Visual Basic doesn’t recognize the accent. So, either you can go through the code and replace all accents (`) with apostrophes (‘), or just try copying the code from this text file instead. https://drive.google.com/file/d/1I5oDfs6wIQnu_shwosGW0inSZRmbhWxE/view?usp=sharing
You’ll notice the code includes one subroutine called “MonteCarloNValues” and if you scroll to the bottom you’ll see a Function called “GetRandomNormal“. The subroutine is the meat of the program. The function is called to compute normally distributed random numbers. Once you have the code inserted, scroll down until you see the following line of code:
strRASProj = “C:\HEC-RAS Examples\Applications Guide\Chapter 1 – Critical Creek\CRITCREK.prj” Change the text inside of the quotes to match the path and file name for where your project is stored on your computer (this line of code should be on line 43 about 1/5 of the way down from the top. Look at the top of the window for the line number. If it’s not on line 43, it’s likely that your code was pasted in without spaces between blocks of code, in which case it will be line 34. Alternatively, you can use the Edit…Find tool to help you find this line of code).
Also make note of the line of code that sets your number of realizations. intNumRealizations = 100 (Line 63, Line 51 without spaces). Here is where you set the number of realizations (iterations) you want to run for your Monte Carlo Analysis. In other words, how many times HEC-RAS will be opened and run. You can change this number to whatever you like. The more realizations you run, the better your statistical convergence will be. It took about 7 hours for me to run 10,000 realizations. But I suggest starting with 100 or less the first time you run this, which should take about 4 minutes or less.
Also, if you are using and referencing a version of HEC-RAS besides 5.0.7, make sure to make that change in the following line of code: Dim RC As New RAS507.HECRASController (Line 35, Line 28 without spaces). If you are using HEC-RAS Version 5.0.7, you don’t have to worry about this.
Step 5. Make sure HEC-RAS is closed and then Run the Monte Carlo simulation. To run the program, click anywhere within the Subroutine MonteCarloNValues and then click the green “play” button at the top of the window. Alternatively, you could press the F5 key to begin the simulation.
If you get a Compile Error at this line of code: Dim RC As New RAS507.HECRASController, make sure you have selected the checkbox next to the Version of RAS you want to use in the References window (see Step 3 above).
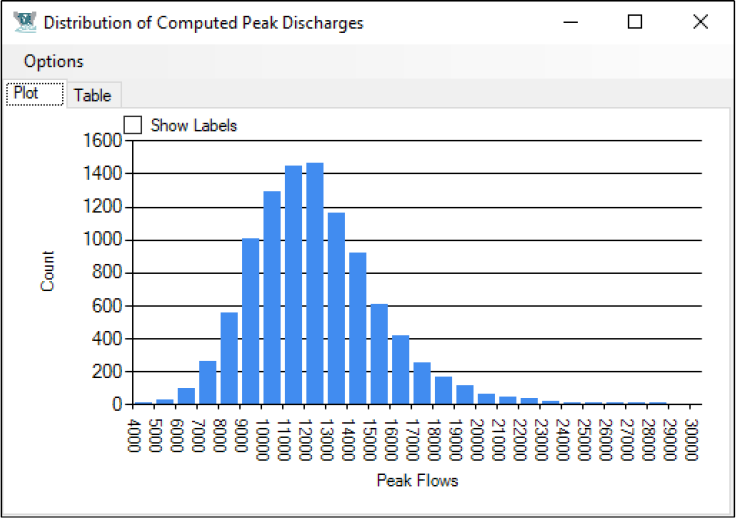
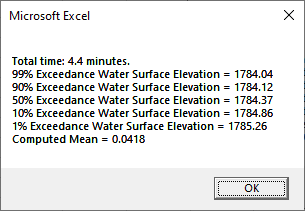
As it’s running, you will see the HEC-RAS Computations window pop up about every 2 seconds or so. Each one of these represents a realization, a single HEC-RAS simulation within the Monte Carlo Analysis. When the Monte Carlo Simulation is done, you should see a message box pop up that tells you the time the simulation took to run. It took 4.4 minutes on my computer to run 100 realizations. The message box also shows you the 99% ,90%, 50%, 10%, and 1% exceedance probability water surface elevations for node ID # 7 (see line 107 of the code). This is River Station 6 in the model. You can determine the node ID for any cross section under Tables…Names…Node Names in the Geometry Window of HEC-RAS. Finally, a computed mean for the sampled n value is displayed. You can check statistical convergence, by running this program several times and see if the computed mean changes and how well it compares to the input mean. Here you can see my computed mean n value is 0.0418, while my input mean was 0.04. If it changes significantly with different MCM simulations, or is significantly different from the input mean, then that implies you need to run more realizations (something greater than 100). When I ran this Monte Carlo exercise with 10,000 realizations, my computed mean was much better at 0.0399. I’d say that’s close enough.
Good luck. You can do this. Once you’re comfortable with this code, you should be well on your way to try any number of other types of HEC-RAS automation applications. Try adding to this code. Maybe you want to print out the exceedance probability water surface elevations for every cross section. Or maybe you want to output a different metric besides water surface elevation. And if you made it this far in the post, I bet you have an interest in automating HEC-RAS. I highly encourage you to check out the book “Breaking the HEC-RAS Code” and the companion Excel HECRASController workbook. They are valuable resources for automating HEC-RAS and explain all of this in much more detail than this single post can.
And finally, check out this video webinar I gave through the Australian Water School on the HECRASController:
Sub MonteCarloNValues()
‘**********************************************************
‘Demonstrates running HEC-RAS in a Monte Carlo Experiment.
‘Written by Christopher Goodell
‘March 29, 2020
‘This subroutine randomly samples n values about a normal _
distribution and applies that n value to the main _
channel of each cross section. The HEC-RAS project _
is re-run after each sampling. Water surface _
elevations are stored at the completion of each _
realization and finally sorted to determine elevation _
exceedance probabilities.
‘Tested with the CRITCREK.prj data set. Code would have _
to be slightly modified to work with other data sets.
‘**********************************************************
‘Keep track of time
Dim timStartTime As Variant, timNowTime As Variant, _
timElapseTime As Variant
timStartTime = Timer
‘Define the normal distribution of n values to use.
Dim sngMeanN As Single
Dim sngStdDevN As Single
sngMeanN = 0.04 ‘mean, or expected value.
sngStdDevN = 0.015 ‘This sets 2 standard deviations to _
plus and minus 0.03 (50%), or _
Manning’s n values of 0.01 to 0.07.
‘Open the HEC-RAS project
Dim RC As New RAS507.HECRASController
Dim strRASProj As String ‘HEC-RAS Project
Dim sngWSElev() As Single
‘The array of computed water surface elevations for _
each realization.
‘Paste the path and filename of your project here in between the quotation marks
strRASProj = “C:\HEC-RAS Examples\Applications Guide\Chapter 1 – Critical Creek\CRITCREK.prj”
‘Open the HEC-RAS project Critical Creek – Example 1
RC.Project_Open (strRASProj)
‘Define variables used in the For-Next Loop
Dim lngNumMessages As Long
Dim strMessages() As String
Dim blnDidItCompute As Boolean
Dim strRiv As String, strRch As String, strRS As String
Dim lngRiv As Long, lngRch As Long, lngRS As Long
Dim sngNL As Single, sngNCh As Single, sngNR As Single
Dim strErrMsg As String
Dim sngSumMean As Single, sngCompMean As Single
Dim sngAllRandN() As Single
Dim nNodes As Long
Dim Nodes() As String
‘Loop through each realization
Dim intNumRealizations As Integer
intNumRealizations = 100 ‘This number should be large _
enough to reach statistical convergence on the _
computed mean and standard deviation of sampled n _
Values.
ReDim sngAllRandN(1 To intNumRealizations)
Dim i As Long, j As Long, k As Long, l As Long
For i = 1 To intNumRealizations
‘Get n value to use by randomly sampling about the _
normal distribution
sngNL = 0.1
sngNCh = CSng(GetRandomNormal(sngMeanN, sngStdDevN))
sngNR = 0.1
‘Keep running tab of the computed mean
sngAllRandN(i) = sngNCh
sngSumMean = sngSumMean + sngNCh
sngCompMean = Round((sngSumMean / i), 4)
‘Define the river, reach and number of nodes for this project
strRiv = “Critical Cr.”
strRch = “Upper Reach”
lngRiv = 1
lngRch = 1
nNodes = RC.Geometry.nNode(1, 1)
‘Apply new n values to geometry
For j = 1 To nNodes
strRS = RC.Geometry.NodeRS(lngRiv, lngRch, j)
RC.Geometry_SetMann_LChR strRiv, _
strRch, strRS, sngNL, sngNCh, _
sngNR, strErrMsg
Next j
‘Save the project with new Manning’s n values
RC.Project_Save
‘Compute the HEC-RAS project
blnDidItCompute = RC.Compute_CurrentPlan _
(lngNumMessages, strMessages())
‘Get water surface elevation output at River 1, Reach _
1, River Station 6, for profile 1. The Output ID _
for water surface elevation is 2. River Station 6 has a node ID of 7.
ReDim Preserve sngWSElev(i)
sngWSElev(i) = RC.Output_NodeOutput(1, 1, 7, 0, 1, 2)
‘Show Progress
timNowTime = Timer
timElapseTime = _
Round((timNowTime – timStartTime) / 60, 2)
Application.StatusBar = “Finished computing ” & _
“realization #” & i & ” of ” & intNumRealizations _
& “. Sampled N Value = ” & Round(sngNCh, 4) & _
“. All Samples Mean N value = ” & sngCompMean & _
“. Elapsed Time: ” & timElapseTime & “minutes.”
Next i
‘Close HEC-RAS
RC.QuitRAS
‘Sort the water surface elevations low to high
Dim blnSorted As Boolean
Dim sngTemp As Single
Dim intX As Integer
blnSorted = False
Do While Not blnSorted
blnSorted = True
For intX = 0 To UBound(sngWSElev) – 1
If sngWSElev(intX) > sngWSElev(intX + 1) Then
sngTemp = sngWSElev(intX + 1)
sngWSElev(intX + 1) = sngWSElev(intX)
sngWSElev(intX) = sngTemp
blnSorted = False
End If
Next intX
Loop
‘Determine the exceedance probability water surface _
elevations.
Dim sngWSEl99 As Single, sngWSEL90 As Single, _
sngWSEL50 As Single, sngWSEL10 As Single, _
sngWSEL1 As Single
sngWSEl99 = sngWSElev(CInt(0.01 * UBound(sngWSElev)))
sngWSEL90 = sngWSElev(CInt(0.1 * UBound(sngWSElev)))
sngWSEL50 = sngWSElev(CInt(0.5 * UBound(sngWSElev)))
sngWSEL10 = sngWSElev(CInt(0.9 * UBound(sngWSElev)))
sngWSEL1 = sngWSElev(CInt(0.99 * UBound(sngWSElev)))
‘Send the exceedance probability water surface elevations _
and computed mean to a message box.
Dim strOutput As String
strOutput = “99% Exceedance Water Surface Elevation = ” & _
Round(sngWSEl99, 2) & Chr(13)
strOutput = strOutput & “90% Exceedance Water Surface ” & _
“Elevation = ” & Round(sngWSEL90, 2) & Chr(13)
strOutput = strOutput & “50% Exceedance Water Surface ” & _
“Elevation = ” & Round(sngWSEL50, 2) & Chr(13)
strOutput = strOutput & “10% Exceedance Water Surface ” & _
“Elevation = ” & Round(sngWSEL10, 2) & Chr(13)
strOutput = strOutput & “1% Exceedance Water Surface ” & _
“Elevation = ” & Round(sngWSEL1, 2) & Chr(13)
timElapseTime = Round((timNowTime – timStartTime) / 60, 1)
MsgBox “Total time: ” & timElapseTime & ” minutes.” & _
Chr(13) & strOutput & “Computed Mean = ” & _
CStr(sngCompMean)
End Sub
Function GetRandomNormal(ByVal Mean As Double, ByVal StdDev _
As Double) As Double
‘**********************************************************
‘Demonstrates how to compute a Random Number about a _
Normal Statistical Distribution
‘Written by Christopher Goodell
‘November 7, 2013
‘Computes a random number from a normal distribution. _
Uses the Box-Muller Transformation Basic Form to _
handle the transformation.
‘**********************************************************
‘Initialize the random-number generator
Randomize
‘Box-Muller uses 2 random numbers (x1, x2) to generate 2 _
random normally distributed numbers (y1, y2). We’ll _
ignore the 2nd Number (y2).
Dim x1 As Double, x2 As Double, y1 As Double, y2 As Double
x1 = Rnd()
x2 = Rnd()
y1 = (-2 * Math.Log(x1)) ^ 0.5 * _
Math.Cos(2 * 3.141592 * x2)
y2 = (-2 * Math.Log(x1)) ^ 0.5 * _
Math.Sin(2 * 3.141592 * x2)
‘Transform y1 about the input mean and standard deviation
GetRandomNormal = (y1) * StdDev + Mean
End Function
Copyright © 2020 The RAS Solution. All rights reserved.


Comments
Vladimir Moya
on April 13, 2020Some time ago I had a similar idea. I developed a tool for automating HEC RAS and performing MonteCarlo for boundary conditions and manniung roughness. I am also developing for hydraulic designs
https://sciengsustainability.blogspot.com/2017/03/automating-hec-ras-tool.html?m=0
Vimal Chandra Sharma
on April 15, 2020When I followed this, The following error was flagging
Run time error ‘9’:
Subscript out of range
When I pressed ‘Debug’ it is showing;
sngWSElev(i) = RC.Output_NodeOutput(1, 1, 7, 0, 1, 2)
Please help in understanding this error
Chris Goodell
on April 15, 2020Hi Vimal, I’d have to see more of your code to know. The subscript that is out of range is “i”, which is the realization number. But I can’t think of what might have caused it to be out of range. Feel free to post your code here and I’ll see if I can figure it out.
Chris M
on May 27, 2020Hi Chris,
This is super interesting. Can the MCM simulations be run for a plain 2D model or a coupled 1d/2d model?
Thanks.
Chris M
Chris Goodell
on May 28, 2020Hi Chris. Yes, you can do MCM for 2D and 1D/2D models. However, if you want to evaluate 2D output (depth, velocity, etc), you’ll have to read from the HDF file. That will require you add in a reference library for reading/writing from/to HDF files. Here’s a good place to start: https://support.hdfgroup.org/news/announcements/AnnouncingPyHexad.pdf
Or you can just google “HDF for VBA” or if you prefer another programming language, you can google HDF for that language. Python has some really good libraries for working with HDF files.
Nicky
on June 11, 2020Hi Chris,
I read this code in the book and was a little confused by the explanation given about it in the book. On page 90-95 you explain the MonteCarloNValues() function. On page 91 you talk about building a new geometry file and the variables “strRASGeom” and “strTmpRASGeom” but I could not find these variables in the MonteCarloNValues() function or anywhere else in the book. Before the MonteCarloNValues() function you mention a different approach to the MonteCarloNValues() using Geometry_SetMannLCh function, but it seems that that function is used in the MonteCarloNValues() function? Sorry for any confusion I was trying to understand that code from the explanation written in the book, but it doesn’t seem like the explanation is about the code in the book. Again sorry for any confusion I’m not sure if I’m missing something.
Best,
Nicky
Nicky Vartanian
on June 11, 2020Hi Chris,
I searched the function Geometry_SetMann_LChR because I wasn’t sure how it was being called and found the link to another post where someone asks the same as above (https://www.kleinschmidtgroup.com/ras-post/automating-hec-ras/) => posts 50 and 51. Thank you! I was beginning to think I was going a little crazy reading the explanation and looking at the code lol 🙂 .
Best,
Nicky
Nicky
on June 11, 2020Sorry to ask so many questions, the first two posts aren’t really needed since it was already resolved elsewhere. Why in this function call in the code above are there no parentheses?
RC.Geometry_SetMann_LChR strRiv, _
strRch, strRS, sngNL, sngNCh, _
sngNR, strErrMsg
Would this not work: RC.Geometry_SetMann_LChR (strRiv, _
strRch, strRS, sngNL, sngNCh, _
sngNR, strErrMsg)
are both ok?
-Nicky
Chris Goodell
on June 11, 2020Hi Nicky. Great questions. Glad to see you trying out the HECRASController. In VBA, parenthesis are required for the arguments of the call is a function. If it’s a subroutine, then no parentheses are required. Not sure why they set it up that way, but it’s just how it is.
Jazz
on October 13, 2022Is it possible to run MCS with DEM ensembles?
Add Your Comment