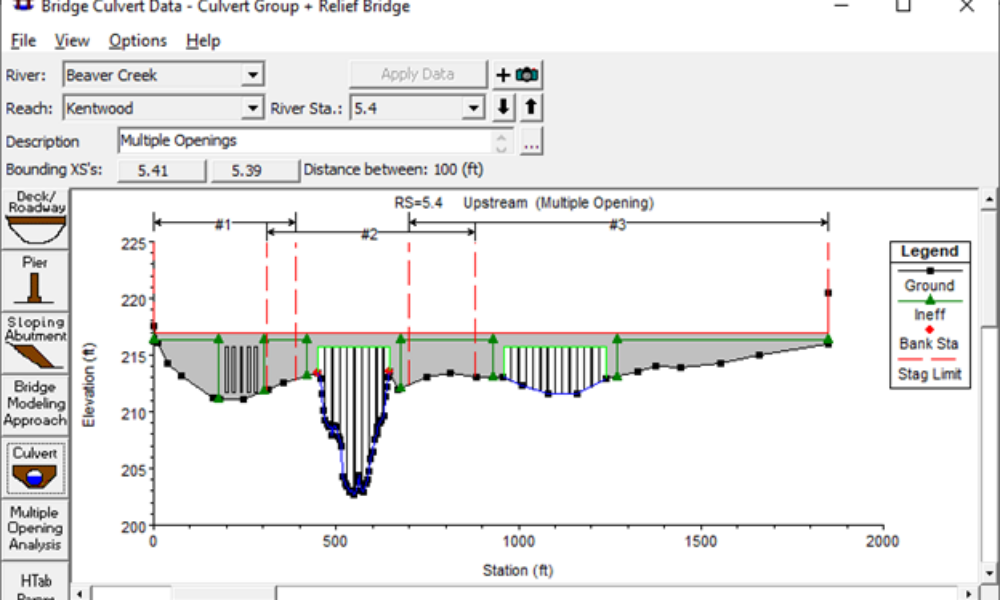
Multiple Opening Analysis
Did you know that if you have a bridge opening and one or more culverts at a single river crossing a Multiple Opening Analysis is required?
Hey RAS Users-
This is a basic level steady flow HEC-RAS class. That’s right, we start from the very beginning with HEC-RAS-steady flow theory, building 1D geometry, steady flow boundary conditions, and even introductions to RAS Mapper and 2D modeling. I’ll be hosting weekly live sessions for this class to review the course material and workshops and for Q&A.
And it’s an online course-that means you can take it from anywhere in the world-just need a computer with a wifi connection.
If you’re relatively new the HEC-RAS, or just need a refresher, come and join me for this excellent intro class on HEC-RAS modeling. Don’t delay, there are limited seats.
Comments
KADJO Bernard
on April 7, 2020I’m interested for this course
Aaron
on June 2, 2020Hello Chris! Will this course be offered again in the future? Also, in a small project setting (say analyzing a 1-2 mile stretch of stream within a 10 square mile drainage shed), why would it be more beneficial to use RAS to model culverts/bridges/inline structures for peak WSELs rather than other software where you can analyze all of these types of structures as dams with storage areas?
Chris Goodell
on June 4, 2020Hi Aaron. Yes, it will be offered this fall both in an online format and an in-person format. Keep your eye out for University of Wisconsin online course offerings. I’ll be posting about it on The RAS Solution as well as the dates are firmed up.
Not sure what you are comparing RAS to, but RAS has specific equations for bridges, culverts, and gates. Not sure why you would want to model a bridge as a dam.
Melissa
on June 28, 2022Hi, can you please help me out finding answers to the following:
Using HEC-RAS 6.2, from the Unsteady Flow Data dialog box, I created 2 rain gage stations over the model domain.
Following are my concerns:
1. When I click on the [Plot Stations…] button, it can be observed that a rectangular extent has been generated over the model domain. However, it is not clear what is the cell size used, how the number of rows and columns are computed and what buffer is taken while generating the rectangular extent.
2. In addition, if I click on the [Rasterization Parameters (Optional)] button, it allows the user to define the raster extent using several options.
However, it is not clear that after using these options, how the extent of the raster is computed. Say for example, if I select Fix Raster Parameters based on current Met Station Extent option, then it generates an additional extent.
However, it is not clear what is the cell size used, how the number of rows and columns are computed and what buffer is taken while generating the rectangular extent.
Kindly help me understand the functionality of Rasterization Parameters.
Add Your Comment